Configuration
Once the PowerMax for Splunk TA and App are installed the next step is to configure them for use in your environment. Both the TA and App have individual configuration steps so each will be detailed separately.
Configuring the TA
From the home dashboard of your Splunk Enterprise UI select the PowerMax for Splunk Add-On from the app list on the left-side App navigation menu.
The Inputs view that opens is the list of all VMAX or PowerMax arrays
registered with this instance of Splunk Enterprise. To add an array to the
Splunk environment click the green button in the top-right corner of the UI
Create New Input.
To add an array to Splunk, you must enter a number of details into Splunk including:
Unisphere instance & user details
Array details
SSL details
Reporting metrics configuration
The tables below lists each option, its default value if there is one, and a
description of the option. Once all options are set, click Add to add the
array as a data input to Splunk.
Note
Configuration options are split into multiple tables for readability, they all apply to the same process of adding a new array as a data input to Splunk.
Splunk Config
Input |
Default |
Description |
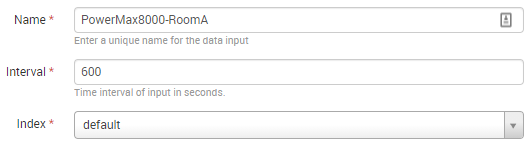
Name |
|
The name of the input as it will appear
in Splunk.
|
Interval |
|
The metrics collection interval. This
should be set in increments of 300s as
this is the reporting interval of
performance metrics in Unisphere.
|
Index |
DefaultSplunk Index |
The index to which data from Unisphere
for this VMAX will be written.
|
Unisphere Config
Input |
Default |
Description |
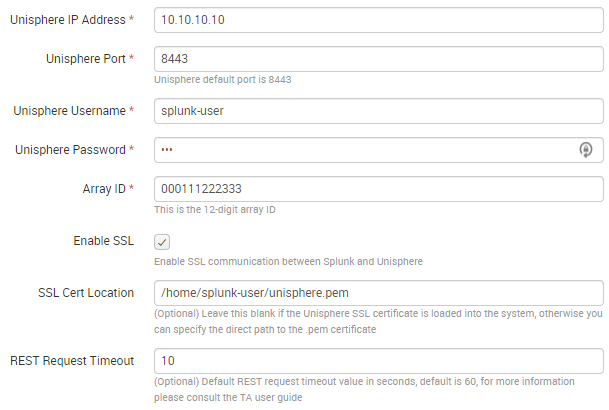
Unisphere
IP Address
|
|
Unisphere IP address or hostname. |
Unisphere
Port
|
|
Unisphere port. |
Unisphere
Username
|
|
Unisphere username. |
Unisphere
Password
|
|
Unisphere password. |
Array ID |
|
The 12-digit numerical PowerMax ID. |
REST
Request
Timeout
|
|
The amount of time Splunk will wait for a
response from Unisphere for any given call
before timing out and logging an error.
|
Metrics Collection Configuration
Note
For a list of valid metrics for each performance category below please
see the the Unisphere for PowerMax Performance Metrics section of this documentation. The metrics
must be in the CamelCase format used in the Unisphere for PowerMax
REST API.
Note
If all custom metrics provided for a given category are invalid, the TA will default to querying only KPI performance metrics for that category.
Note
The PowerMax for Splunk TA is configured to run entirely from KPI metrics, if you do not need any further functionality from the TA and App other than to use the App for PowerMax monitoring then you only need to set each performance category to collect KPI metrics.
Input |
Default |
Description |
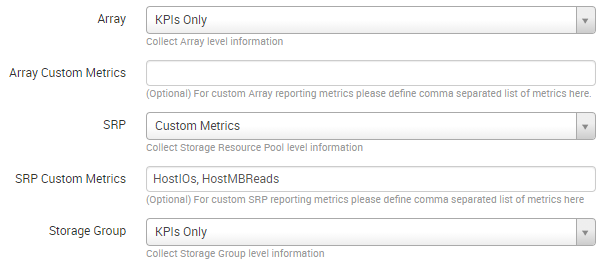
Array |
|
Collect all/kpi/custom Array level
metrics or disable entirely.
|
Array Custom
Metrics
|
|
Comma separated list of Array metrics if
custom metrics selected.
|
SRP |
|
Collect all/kpi/custom SRP level
metrics or disable entirely.
|
SRP Custom
Metrics
|
|
Comma separated list of SRP metrics if
custom metrics selected.
|
Storage
Group (SG)
|
|
Collect all/kpi/custom SG level
metrics or disable entirely.
|
SG Custom
Metrics
|
|
Comma separated list of SG metrics if
custom metrics selected.
|
Director |
|
Collect all/kpi/custom Director level
metrics or disable entirely.
|
FE Director
Metrics
|
|
Comma separated list of FE Director
metrics if custom Director metrics
selected.
|
BE Director
Metrics
|
|
Comma separated list of BE Director
metrics if custom Director metrics
selected.
|
RDF Director
Metrics
|
|
Comma separated list of RDF Director
metrics if custom Director metrics
selected.
|
IM Director
Metrics
|
|
Comma separated list of IM Director
metrics if custom Director metrics
selected.
|
EDS Director
Metrics
|
|
Comma separated list of EDS Director
metrics if custom Director metrics
selected.
|
Port |
|
Collect all/kpi/custom Port level
metrics or disable entirely.
|
FE Port
Metrics
|
|
Comma separated list of FE Port metrics
if custom Port metrics selected.
|
BE Port
Metrics
|
|
Comma separated list of BE Port metrics
if custom Port metrics selected.
|
RDF Port
Metrics
|
|
Comma separated list of RDF Port metrics
if custom Port metrics selected.
|
Port Group
(PG)
|
|
Collect all/kpi/custom PG level metrics
or disable entirely.
|
PG Custom
Metrics
|
|
Comma separated list of PG metrics if
custom metrics selected.
|
iSCSI |
|
Collect all/kpi/custom iSCSI level
metrics or disable entirely.
|
IP Interface
Metrics
|
|
Comma separated list of IP Interface
metrics if custom iSCSI metrics
selected.
|
iSCSI Target
Metrics
|
|
Comma separated list of iSCSI Target
metrics if custom iSCSI metrics
selected.
|
Host |
|
Collect all/kpi/custom Host level
metrics or disable entirely.
|
Host Custom
Metrics
|
|
Comma separated list of Host metrics if
custom metrics selected.
|
Masking
View (MV)
|
|
Collect all/kpi/custom MV level metrics
or disable entirely.
|
MV Custom
Metrics
|
|
Comma separated list of MV metrics if
custom metrics selected.
|
Initiator |
|
Collect all/kpi/custom Initiator level
metrics or disable entirely.
|
Initiator
Custom
Metrics
|
|
Comma separated list of Initiator
metrics if custom metrics selected.
|
RDF Group |
|
Collect all/kpi/custom RDF Group level
metrics or disable entirely.
|
RDF/S Group
Custom
Metrics
|
|
Comma separated list of RDF/S Group
metrics if custom RDF metrics selected.
|
RDF/A Group
Custom
Metrics
|
|
Comma separated list of RDF/A Group
metrics if custom RDF metrics selected.
|
Metro DR |
|
Collect Metro Disaster Recovery level
information or disable entirely.
|
Snapshot Policy |
|
Collect Snapshot Policy level
information or disable entirely.
|
Audit Logs |
|
Collect Audit Log information or disable
entirely.
|
Alerts |
|
Collect Alerts information or disable
entirely.
|
Usage Considerations
When using PowerMax for Splunk for performance metrics collection there are a number of usage considerations that you should keep in mind:
The PowerMax for Splunk TA is configured to run entirely from KPI metrics, if you do not need any further functionality from the TA and App other than to use the App for PowerMax monitoring then you only need to set each performance category to collect KPI metrics.
If defining a list of custom metrics for a performance category, the format of those metrics should be in
CamelCaseexactly as they are in the Unisphere for PowerMax official documentation performance section. More information available below in the section Performance Metrics Definitions.After enabling Unisphere for performance metrics collection allow Unisphere 30 minutes to gather enough data before adding the array to Splunk as a data input.
The most granular time available with Unisphere diagnostic performance metrics collection is 300 seconds, reporting intervals cannot be set lower than 300 seconds.
If you are collecting metrics from multiple arrays it may take longer than 300 seconds to complete an entire collection run. If this does happen you will see warning messages in your TA logs along with a recommendation on what interval should be set.
If the Unisphere last available performance timestamp is not recent as of 5-10 minutes ago there is a strong likelihood that your instance of Unisphere has gone into catch-up mode and is processing a backlog of performance data. It will resume normal operations once this backlog processing is complete.
When querying a single instance of Unisphere for performance metrics across a multiple arrays be careful on the load placed on Unisphere, more arrays equates to more Unisphere REST API calls.
Lastly, and most importantly, with great power comes great responsibility. PowerMax for Splunk provides you with the ability to query every performance metric for a wide range of performance categories. It is important to remember that the more assets you have created on an array, the more REST calls that are required to collect information on all of those assets. Multiply that by the interval set and it can quickly result in a very large volume of calls to Unisphere.
Instead of gathering everything possible, be resourceful with your calls and only query what is needed. This will ensure PowerMax for Splunk is performant and helps reduce network load and the Unisphere for PowerMax user experience is not negatively affected by excessive REST API calls. If you are only interested in querying for KPIs, you can specify that only KPI metrics are returned, but better still only query for a subset of metrics that you are interested in if you do not require the full suite of dashboards available in the PowerMax for Splunk App.
Where to find logs
If you are having issues with the TA or want to check on the performance of metric collection runs you will need to look at the TA specific log file. The default location for this log file is:
{splunk_install_dir}/var/log/splunk/ta_dellemc_vmax_inputs.log
The second important log is the splunkd log file. If there is issues
initialising the TA and nothing is appearing in the TA log, the splunkd
logs may provide some answers. When Splunk is starting up there should be
warning or error messages for the TA indicating why there is initialisation
issues. The default location for this log file is:
{splunk_install_dir}/var/log/splunk/splunkd.log
Configuring the App
After configuring the PowerMax for Splunk TA with your data inputs, if you have selected a target index for the inputs other than the default index used by Splunk you will need to reconfigure the PowerMax for Splunk App search macros.
Note
Search macros are reusable blocks of Search Processing Language (SPL) that you can insert into other searches. They are used when you want to use the same search logic on different parts or values in the data set dynamically.
For each of the performance and reporting categories supported by PowerMax for Splunk TA and App there is an associated search macro that points to a particular index to retrieve PowerMax data.
Navigate to the installation directory of the PowerMax for Splunk App which
contains all default configuration files. Copy the macros.conf file from
the App default config directory to the App local config directory:
$ cd {splunk_dir}/etc/apps/Dell-EMC-app-VMAX
$ cp default/macros.conf local/macros.conf
Edit the newly copied version of macros.conf in the local directory
so that each index= key/value pair represents the indexes in use in your
environment. Each reporting level ingested by the PowerMax for Splunk TA
corresponds to a macro in macros.conf so all will need updated.
Example:
[powermax_array]
definition = index=main sourcetype=dellemc:vmax:rest reporting_level="Array"
iseval=0

[powermax_srp]
definition = index=main sourcetype=dellemc:vmax:rest reporting_level="SRP"
iseval=0
Becomes..
[powermax_array]
definition = index=powermax sourcetype=dellemc:vmax:rest reporting_level="Array"
iseval=0

[powermax_srp]
definition = index=powermax sourcetype=dellemc:vmax:rest reporting_level="SRP"
iseval=0
Once all the macros have been updated to reflect the indexes in use, save the file and return to Splunk UI. It is advisable here to restart your Splunk Enterprise server here so changes made here are applied.
Splunk Source Type
The PowerMax for Splunk TA provides the index-time and search-time knowledge
for inventory, performance metrics, summary, alert and audit log information.
By default, all array data is indexed into the default Splunk index, this is
the main index unless changed by the splunk admin.
The source type used for the PowerMax for Splunk TA is
dellemc:vmax:rest. All events are in snake_case key/value pair formats.
All events have an assigned reporting_level which indicates the level at
which the event details, along with the associated array_id & if reporting
at lower levels, the object ID e.g. storage_group_id, director_id,
host_id.
Note
vmax is still used in dellemc:vmax:rest instead of powermax
so reporting on historical data ingested into earlier releases of VMAX for
Splunk is not broken. This may change in a future release but for now it
is staying the same.
The TA collects many different kinds of events for VMAX/PowerMax. Depending on
the activity of the Hosts & Initiators in your environment, there may be events
where there are no performance metrics collected. This can be confirmed if
there is a metric present in the event named {reporting_level}_perf_details
with a value of False (where reporting_level is the reporting level of
the event itself). For more information see the section
Active vs. Inactive Objects.
Active vs. Inactive Objects
To limit the amount of data collected and stored on an array, only active Hosts and Initiators are reported against for performance metrics. Inactivity is determined by no activity being recorded by performance monitors for a specified amount of time.
This is not enforced by Splunk but is the behaviour of the VMAX/PowerMax, recording zero values for every Host and Initiator in an environment could potentially very quickly fill databases with useless data.
When the TA is collecting information on the Hosts or Initiators in your environment, it will first obtain a list of all objects and performance key timestamps for each. Using these lists, REST calls will be made to Unisphere for performance metrics for each where a performance key timestamp exists, if an object is inactive no performance call will be made and no metrics returned. This new approach which differs from older releases cuts down on the amount of calls required, it is not necessary to query for performance data if we know in advance that a host or initiator is inactive.
If a host or initiator is inactive you will see the following key/value pairs in the event data:
Format:
{reporting_level}_perf_details: false
{reporting_level}_perf_message: No active {reporting_level} performance data available
Example:
host_perf_details: false
host_perf_message: No active Host performance data available
Performance Metrics Definitions
The PowerMax for Splunk TA ingests a wide range of metrics across each of the
reporting levels. To get detailed definitions of each please consult the
official Unisphere for PowerMax documentation available through the Unisphere
UI in Help Options > Online Help.
When in the official documentation performance metrics can be found in the
section Performance Management > Performance Management Metrics. From there
you can select the performance category you want to see available metrics for.
Unfortunately this list does not provide users with the format required for each of these performance categories when querying for data via REST. To assist with this process there is a list of REST API valid metrics available in the section Unisphere for PowerMax Performance Metrics.
To get further information on the Unisphere for PowerMax REST API you can now visit the Dell API Marketplace.